Mastering Zabbix graphs and Dashboards
This one-day advanced training course is designed for engineers who are already working with Zabbix and want to enhance their monitoring capabilities specifically with visualisation
The focus of this course is to master Zabbix visualization features, offering hands-on guidance for designing intuitive graphs, network maps, and dashboards to monitor and analyze system performance. It explores Zabbix 7.4’s visualization capabilities, including widget configuration, data aggregation techniques, and custom visualization templates.
The course emphasizes practical skills for creating visually appealing and functional displays for real-time insights. Students will engage in practical tasks to configure and optimize dashboards for monitoring diverse IT environments, including servers, networks, and applications. Aimed at users with foundational Zabbix knowledge, no prior certification is required.
Pricing
We offer these course from all our companies, in local currency.
All courses are priced per attendee, and there is 1 exam included by default.
Euro: €490
US Dollar: $590
Pound Sterling: £425
Acquired skills and knowledge

Core visualisation concepts
Understand the core concepts of Zabbix visualization and its role in effective IT monitoring

Dashboard design
Design and optimize interactive dashboards for real-time monitoring of servers, networks and applications

Widget and map setup
Configure and customize widgets, graphs and network maps using Zabbix native UI

Reporting insights
Create and customize detailed reports to effectively communicate monitoring data and insights to decision makers and team members
Outcomes
Organizational impact
Effective visualization is critical for monitoring and managing complex IT infrastructures. Dashboards, graphs, and network maps provide clear insights into system performance, enabling organizations to make data-driven decisions.
During this course, attendees will learn how to configure and optimize Zabbix visualization tools to monitor key performance metrics across servers, networks, and applications, facilitating proactive troubleshooting, capacity planning, and improved operational efficiency.


Individual impact
By attending this course, attendees will not only familiarize themselves with how monitoring can be extended to various DBMS, but also learn how to automate database metric discovery and optimize DBMS data collection for both technical and business-oriented goals.
Course program - Mastering Zabbix graphs and dashboards
Day 1
- Introduction
- Dashboards
- Zabbix reporting services
- Classic graphs
- Dashboard widgets
- Network maps
- Navigation widgets
Zabbix Exam
To be taken:
- Directly after the training ends
Certificates and gifts
For all attendees

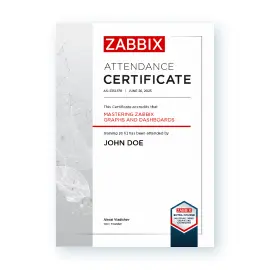
Course attendance certificate
For passing the exam

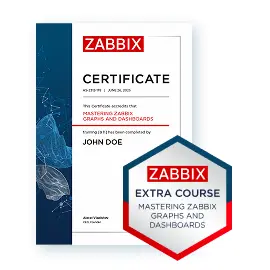
Zabbix 7.0 certificate + digital badge